Network interface SNMP traffic counters for accounting in Prometheus and Grafana
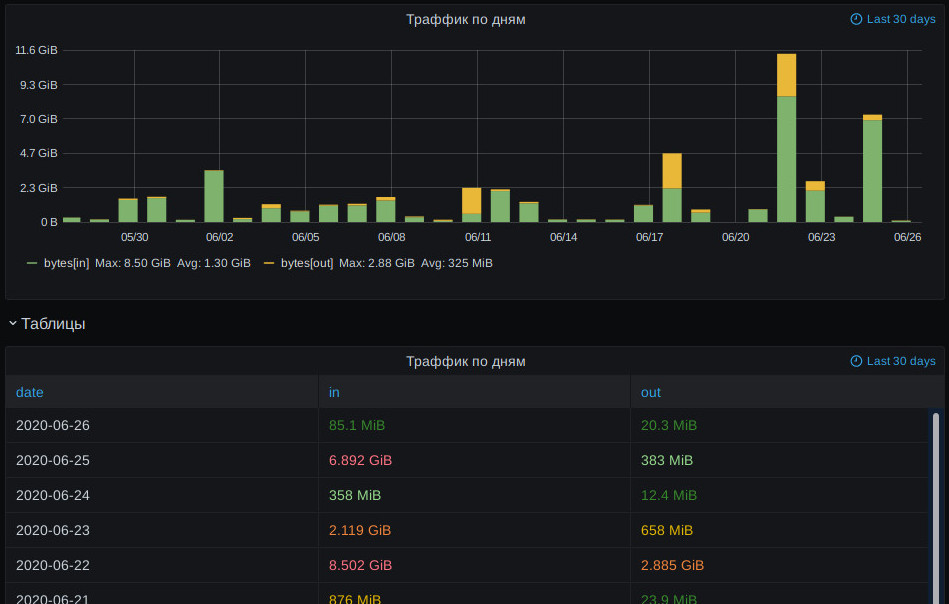
Usual and useful way to represent traffic counters for accounting purposes like "how much inbound/outbound traffic passed thru within specific day/month/year?" are bar charts or tables I think, i.e. something like this:

With one bar or table entry there for each day, month or year (accounting periods).
Counter values in general are not special in prometheus, so grafana builds the usual monotonic-line graphs for these by default, which are not very useful.
Results of prometheus query like increase(iface_traffic_bytes_total[1d]) are also confusing, as it returns arbitrary sliding windows, with points that don't correspond to any fixed accounting periods.
But grafana is not picky about its data sources, so it's easy to query prometheus and re-aggregate (and maybe cache) data as necessary, e.g. via its "Simple JSON" datasource plugin.
To get all historical data, it's useful to go back to when metric first appeared, and official prometheus clients add "_created" metric for counters, which can be queried for min value to get (slightly pre-) earliest value timestamp, for example min_over_time(iface_traffic_bytes_created[10y]).
From there, value for each bar will be diffs between min/max for each accounting interval, that can be queried naively via min_over_time + max_over_time (like created-time above), but if exporter is written smartly or persistent 64-bit counters are used (e.g. SNMP IF-MIB::ifXEntry), these lookups can be simplified a lot by just querying min/max values at the start and end of the period, instead of having prometheus do full sweep, which can be especially bad on something like a year of datapoints.
Such optimization can potentially return no values, if data at that interval start/end was missing, but that's easy to work around by expanding lookup range until something is returned.
Deltas between resulting max/min values are easy to dump as JSON for bar chart or table in response to grafana HTTP requests.
Had to implement this as a prometheus-grafana-simplejson-aggregator py3 script (no deps), which runs either on timer to query/aggregate latest data from prometheus (to sqlite), or as a uWSGI app which can be queried anytime from grafana.
Also needed to collect/export data into prometheus over SNMP for that, so related script is prometheus-snmp-iface-counters-exporter for SNMPv3 IF-MIB/hrSystemUptime queries (using pysnmp), exporting counters via prometheus client module.
(note - you'd probably want to check and increase retention period in prometheus for data like that, as it defaults to dropping datapoints older than a month)
I think aggregation for such accounting use-case can be easily implemented in either prometheus or grafana, with a special fixed-intervals query type in the former or more clever queries like described above in the latter, but found that both seem to explicitly reject such use-case as "not supported". Oh well.
Code links (see README in the repo and -h/--help for usage info):