gnuplot for live "last 30 seconds" sliding window of "free" (memory) data
Was looking at a weird what-looks-like-a-memleak issue somewhere in the system on changing desktop background (somewhat surprisingly complex operation btw) and wanted to get a nice graph of "last 30s of free -m output", with some labels and easy access to data.
A simple enough task for gnuplot, but resulting in a somewhat complicated solution, as neither "free" nor gnuplot are perfect tools for the job.
First thing is that free -m -s1 doesn't actually give a machine-readable data, and I was too lazy to find something better (should've used sysstat and sar!) and thought "let's just parse that with awk":
free -m -s $interval |
  awk '
    BEGIN {
      exports="total used free shared available"
      agg="free_plot.datz"
      dst="free_plot.dat"}
    $1=="total" {
      for (n=1;n<=NF;n++)
        if (index(exports,$n)) headers[n+1]=$n }
    $1=="Mem:" {
      first=1
      printf "" >dst
      for (n in headers) {
        if (!first) {
          printf " " >>agg
          printf " " >>dst }
        printf "%d", $n >>agg
        printf "%s", headers[n] >>dst
        first=0 }
      printf "\n" >>agg
      printf "\n" >>dst
      fflush(agg)
      close(dst)
      system("tail -n '$points' " agg " >>" dst) }'
That might be more awk than one ever wants to see, but I imagine there'd be not too much space to wiggle around it, as gnuplot is also somewhat picky in its input (either that or you can write same scripts there).
I thought that visualizing "live" stream of data/measurements would be kinda typical task for any graphing/visualization solution, but meh, apparently not so much for gnuplot, as I haven't found better way to do it than "reread" command.
To be fair, that command seem to do what I want, just not in a much obvious way, seamlessly updating output in the same single window.
Next surprising quirk was "how to plot only last 30 points from big file", as it seem be all-or-nothing with gnuplot, and googling around, only found that people do it via the usual "tail" before the plotting.
Whatever, added that "tail" hack right to the awk script (as seen above), need column headers there anyway.
Then I also want nice labels - i.e.:
- How much available memory was there at the start of the graph.
- How much of it is at the end.
- Min for that parameter on the graph.
- Same, but max.
Ok, so without further ado...
src='free_plot.dat'
y0=100; y1=2000;
set xrange [1:30]
set yrange [y0:y1]

# --------------------
set terminal unknown
stats src using 5 name 'y' nooutput

is_NaN(v) = v+0 != v
y_first=0
grab_first_y(y) = y_first = y_first!=0 && !is_NaN(y_first) ? y_first : y
grab_last_y(y) = y_last = y

plot src u (grab_first_y(grab_last_y($5)))
x_first=GPVAL_DATA_X_MIN
x_last=GPVAL_DATA_X_MAX

# --------------------
set label 1 sprintf('first: %d', y_first) at x_first,y_first left offset 5,-1
set label 2 sprintf('last: %d', y_last) at x_last,y_last right offset 0,1
set label 3 sprintf('min: %d', y_min) at 0,y0-(y1-y0)/15 left offset 5,0
set label 4 sprintf('max: %d', y_max) at 0,y0-(y1-y0)/15 left offset 5,1

# --------------------
set terminal x11 nopersist noraise enhanced
set xlabel 'n'
set ylabel 'megs'

set style line 1 lt 1 lw 1 pt 2 pi -1 ps 1.5
set pointintervalbox 2

plot\
  src u 5 w linespoints linestyle 1 t columnheader,\
  src u 1 w lines title columnheader,\
  src u 2 w lines title columnheader,\
  src u 3 w lines title columnheader,\
  src u 4 w lines title columnheader,\

# --------------------
pause 1
reread
Probably the most complex gnuplot script I composed to date.
Yeah, maybe I should've just googled around for an app that does same thing, though I like how this lore potentially gives ability to plot whatever other stuff in a similar fashion.
That, and I love all the weird stuff gnuplot can do.
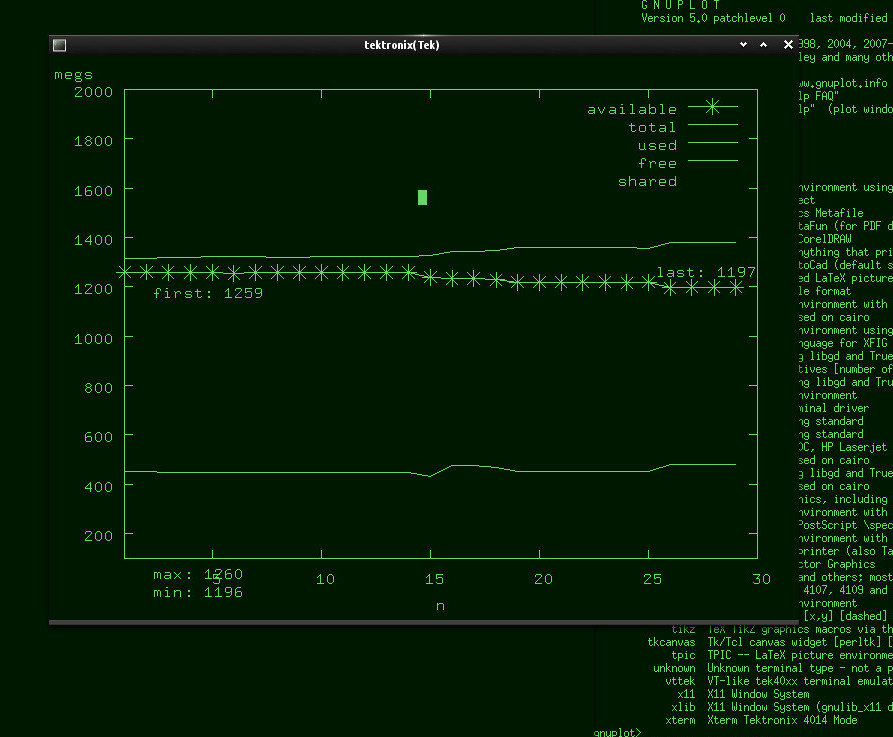
For instance, xterm apparently has some weird "plotter" interface hardware terminals had in the past:

And there's also the famous "dumb" terminal for pseudographics too.
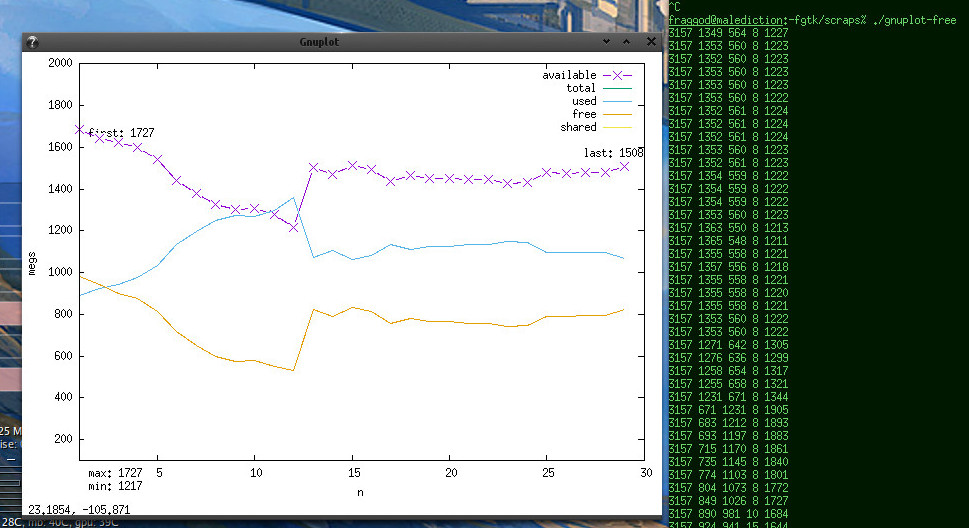
Regular x11 output looks nice and clean enough though:

It updates smoothly, with line crawling left-to-right from the start and then neatly flowing through. There's a lot of styling one can do to make it prettier, but I think I've spent enough time on such a trivial thing.
Didn't really help much with debugging though. Oh well...
Full "free | awk | gnuplot" script is here on github.